Debugging/Profiling
In this chapter you will learn about the debugging and profiling methods available in the framework.

Why Debugging/Profiling?
Debugging and profiling are critical for maintaining code quality and runtime performance.
- Debugging helps trace logic errors, unexpected behavior and integration issues.
- Profiling reveals performance bottlenecks, memory usage and CPU/GPU load.
Together, they provide insight into how your system behaves under real conditions, allowing you to optimize workflows, reduce latency etc.
Debugging C++ Scripts
Debugging is a critical aspect of programming, but in the C/C++ world it's especially crucial as we're dealing with a native language. Unlike interpreted languages, tracing and debugging in C/C++ can be much more challenging. Jenova Framework offers a comprehensive debugging solution for developers, providing a robust and effective way to identify and resolve issues in their code.
By exporting your project from Jenova to either Visual Studio or Visual Studio Code, the process automates the generation of a debugging setup, allowing for a one-click workflow to initiate debugging of your C++ scripts without any additional configuration requirements.
Debugging in Visual Studio
When it comes to debugging C/C++, Visual Studio is the omnipotent Zeus, Oracle and the Prometheus all merged into one majestic deity :D Visual Studio delivers the ultimate experience with its comprehensive debugging, making it the top choice for the most complex C++ scripts.
To begin debugging your Jenova C++ scripts using Visual Studio, follow these step-by-step instructions :
- Navigate to Editor > Editor Settings... and select the Jenova tab.
- Set External Changes Trigger Mode option to Bootstrap Project on Watchdog Invoke and save settings.
- Open Jenova main menu and select
 Export to Visual Studio...
 - Open the generated Visual Studio Solution in Visual Studio.
- Set breakpoints, expressions, watch variables, and debug breaks etc.
- Run the project by clicking Debug > Start Debugging menu or pressing F5
- Now you can start debugging your C++ scripts using Visual Studio!
While Visual Studio doesn't require the Jenova Compiler Interface for compilation, it still needs the editor instance running alongside for bootstrapping the compiled module, this is essential for debugging to function correctly.
Debugging in Visual Studio Code
Since Visual Studio is exclusively designed for Windows, a comprehensive debugging configuration is also provided for Visual Studio Code.
Visual Studio Code lags behind Visual Studio in debugging, but still offers various debuggers for the task.
To begin debugging your Jenova C++ scripts using Visual Studio Code, follow these step-by-step instructions :
- Ensure you have C/C++ Tools Extension (ms-vscode.cpptools) installed on your Visual Studio Code.
- Open Jenova main menu and select
 Export to Visual Studio Code...
 - Open the generated project in Visual Studio Code.
- Set breakpoints, expressions, watch variables, and debug breaks etc.
- Switch to the editor and Buid the project.
- Navigate to
 Run and Debug panel and make sure Jenova Module Debug profile is selected.
 - Run the project by clicking Run > Start Debugging menu or pressing F5
- Now you can start debugging your C++ scripts using Visual Studio Code!
Unlike Visual Studio, debugging a Jenova project with VSCode requires building from the engine editor. To automate this step, you can use the External Changes Trigger Mode option by setting it to Build Project on Script Change mode.
- Same method can be applied to debug your project using the Jenova Code IDE as a built-in code editor.
- You can debug the Jenova Runtime, Jenova Module and engine at the same time using the mentioned workflows.
Debugging in 3rd-party Tools
Beside Visual Studio and VSCode, you can also utilize any debugger of your choice by simply passing --Enable-Debug-Mode to the engine.
For example, to debug the project in x64dbg, follow these step-by-step instructions :
- Build the project in the editor.
- Open x64dbg and select engine executable.
- From the File menu, select Change Command Line
- Enter the following command line :
<Engine Executable Path> --path <Project Path> --Enable-Debug-Mode - Open Debug menu and select Restart or press Ctrl + F2
- Jenova module will now be loaded with its debug symbols, allowing you to debug it in detail.
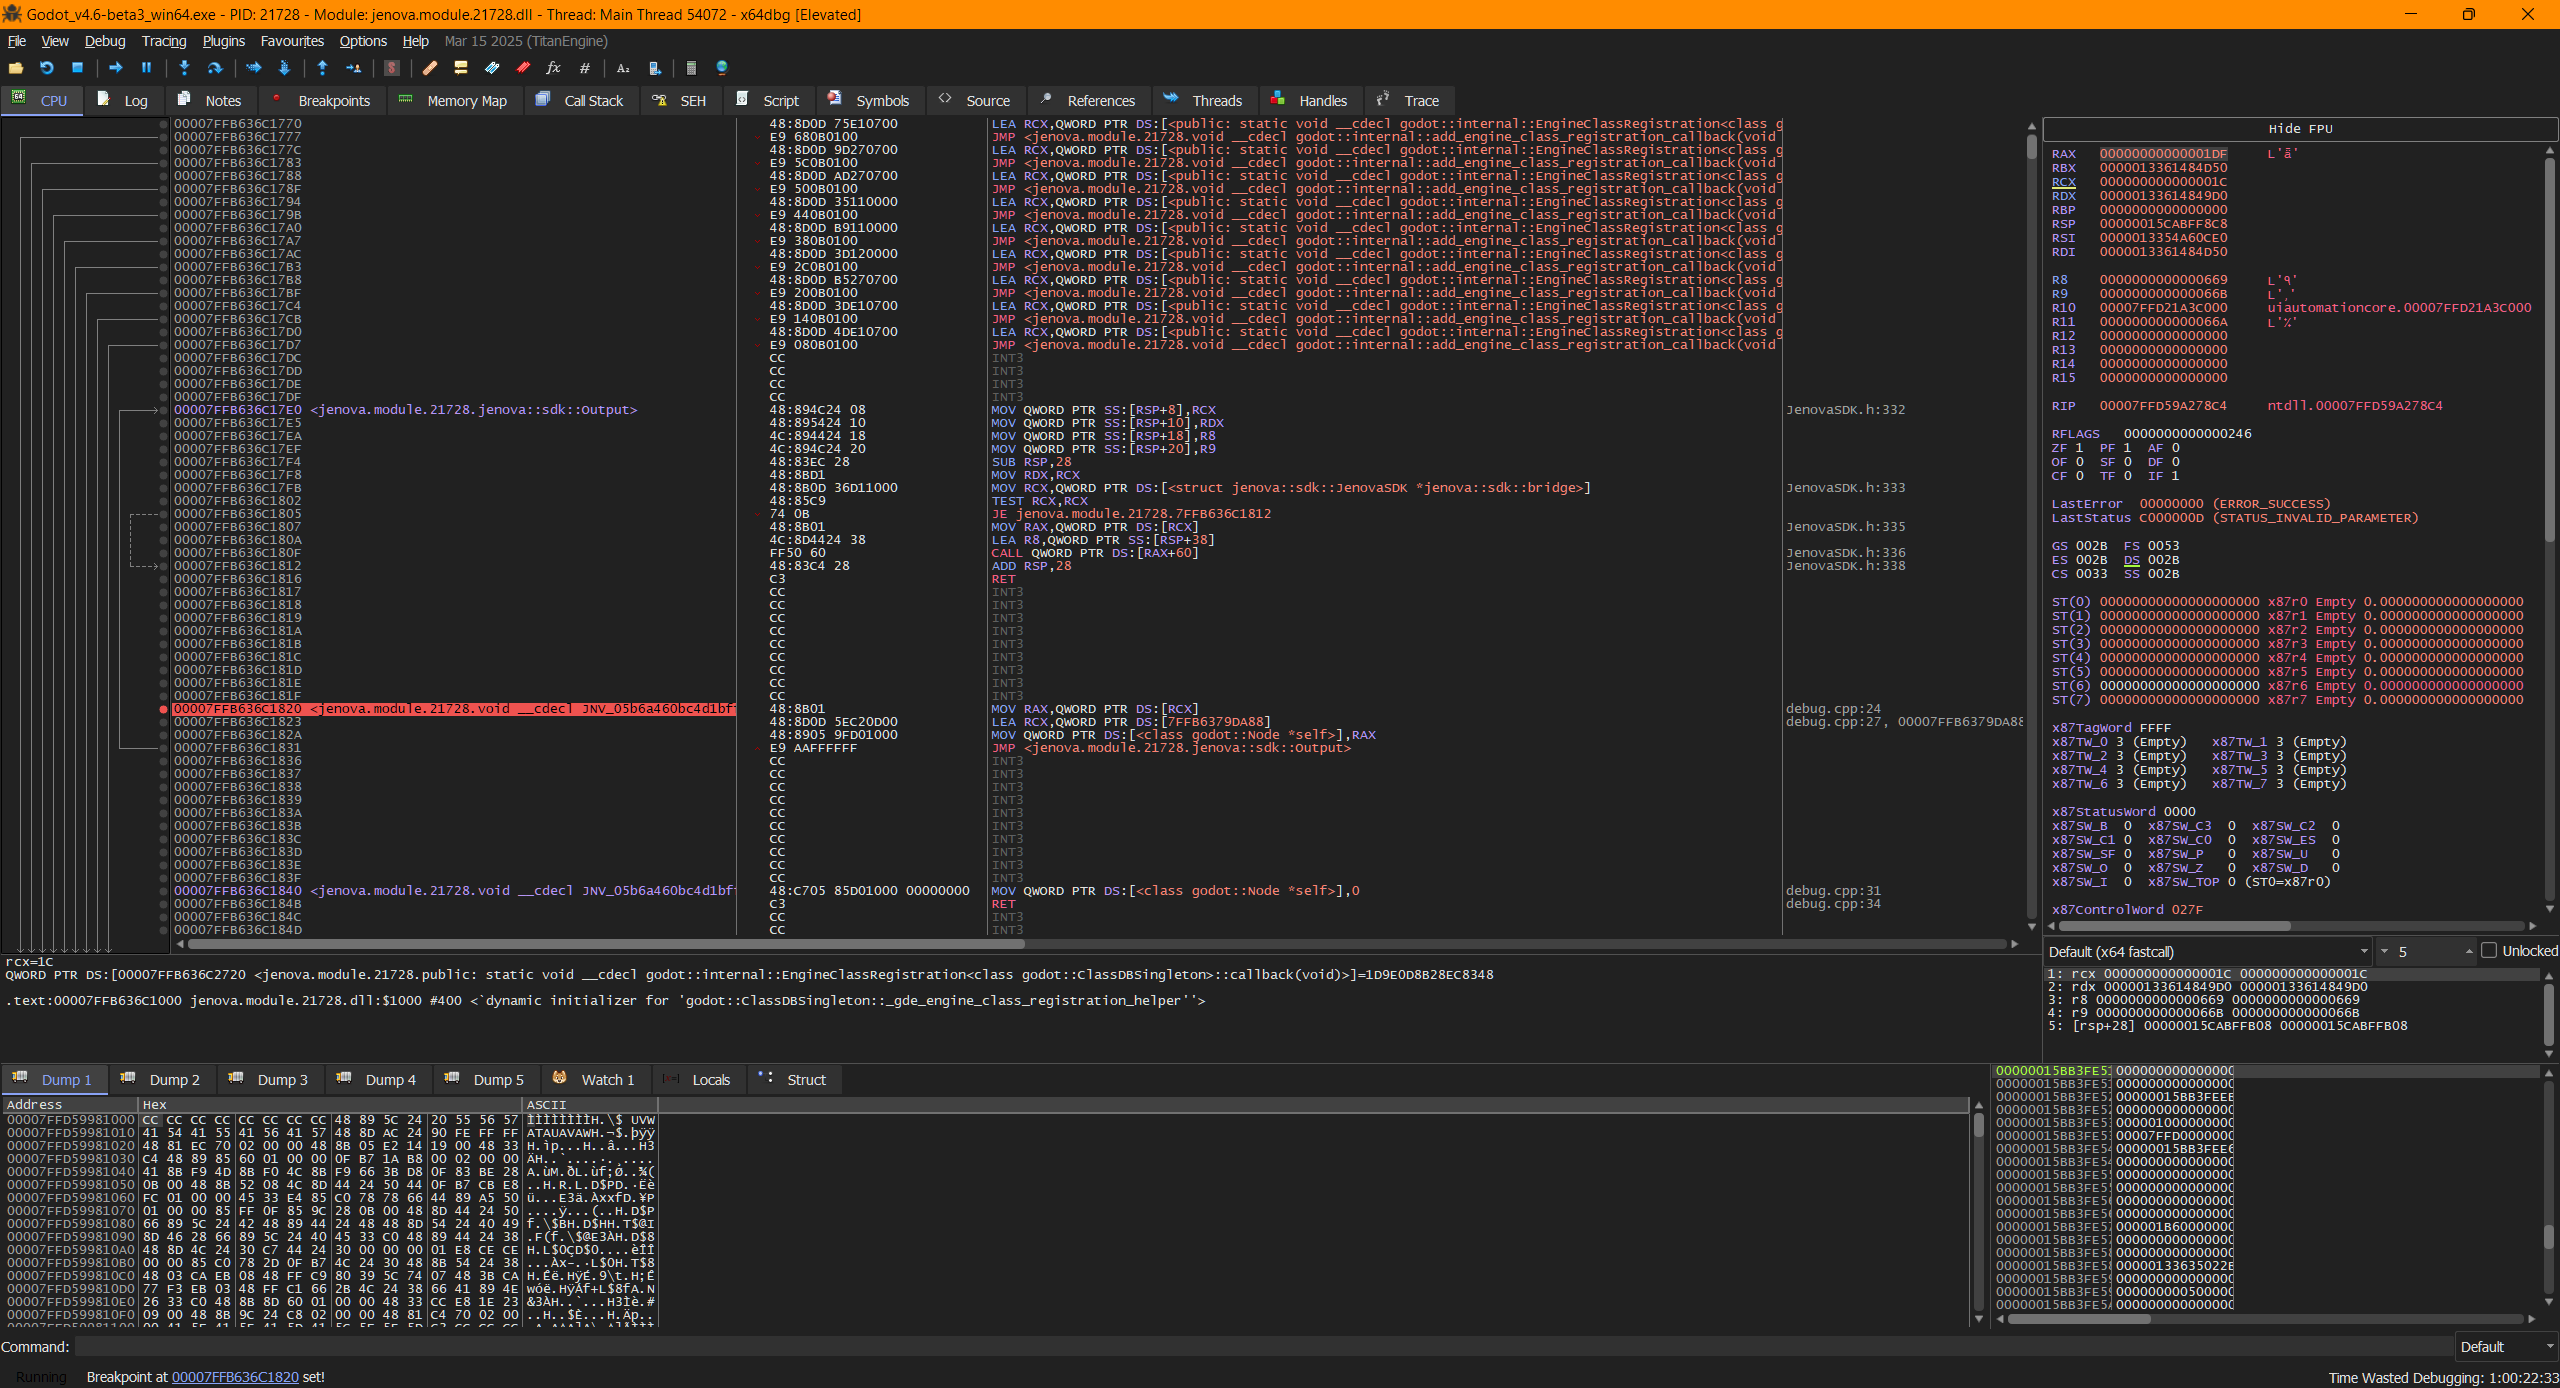
x64dbg Advanced Debugger, Debugging Jenova C++ code at machine code level.
You can also debug Tool Scripts by using the same approach and adding the --editor flag to the command line.
By default, Debug Mode feature is enabled in Jenova Runtime builds, which can leave your game vulnerable to attackers who can modify or manipulate your compiled binary data. To mitigate this risk, it's recommended to build your own Jenova Runtime from source by compiling it with the --protected-mode flag for public releases.
- Keep in mind that any debugging process requires the Generate Debug Information option to be enabled.
- MSE Feature is enabled by default to prevent crashes. For debugging, build the project with the option disabled to catch exceptions.
- In versions beyond 0.3.9.3, disabling Managed Safe Execution (MSE) is no longer necessary for debugging purposes.
Visual Debugging
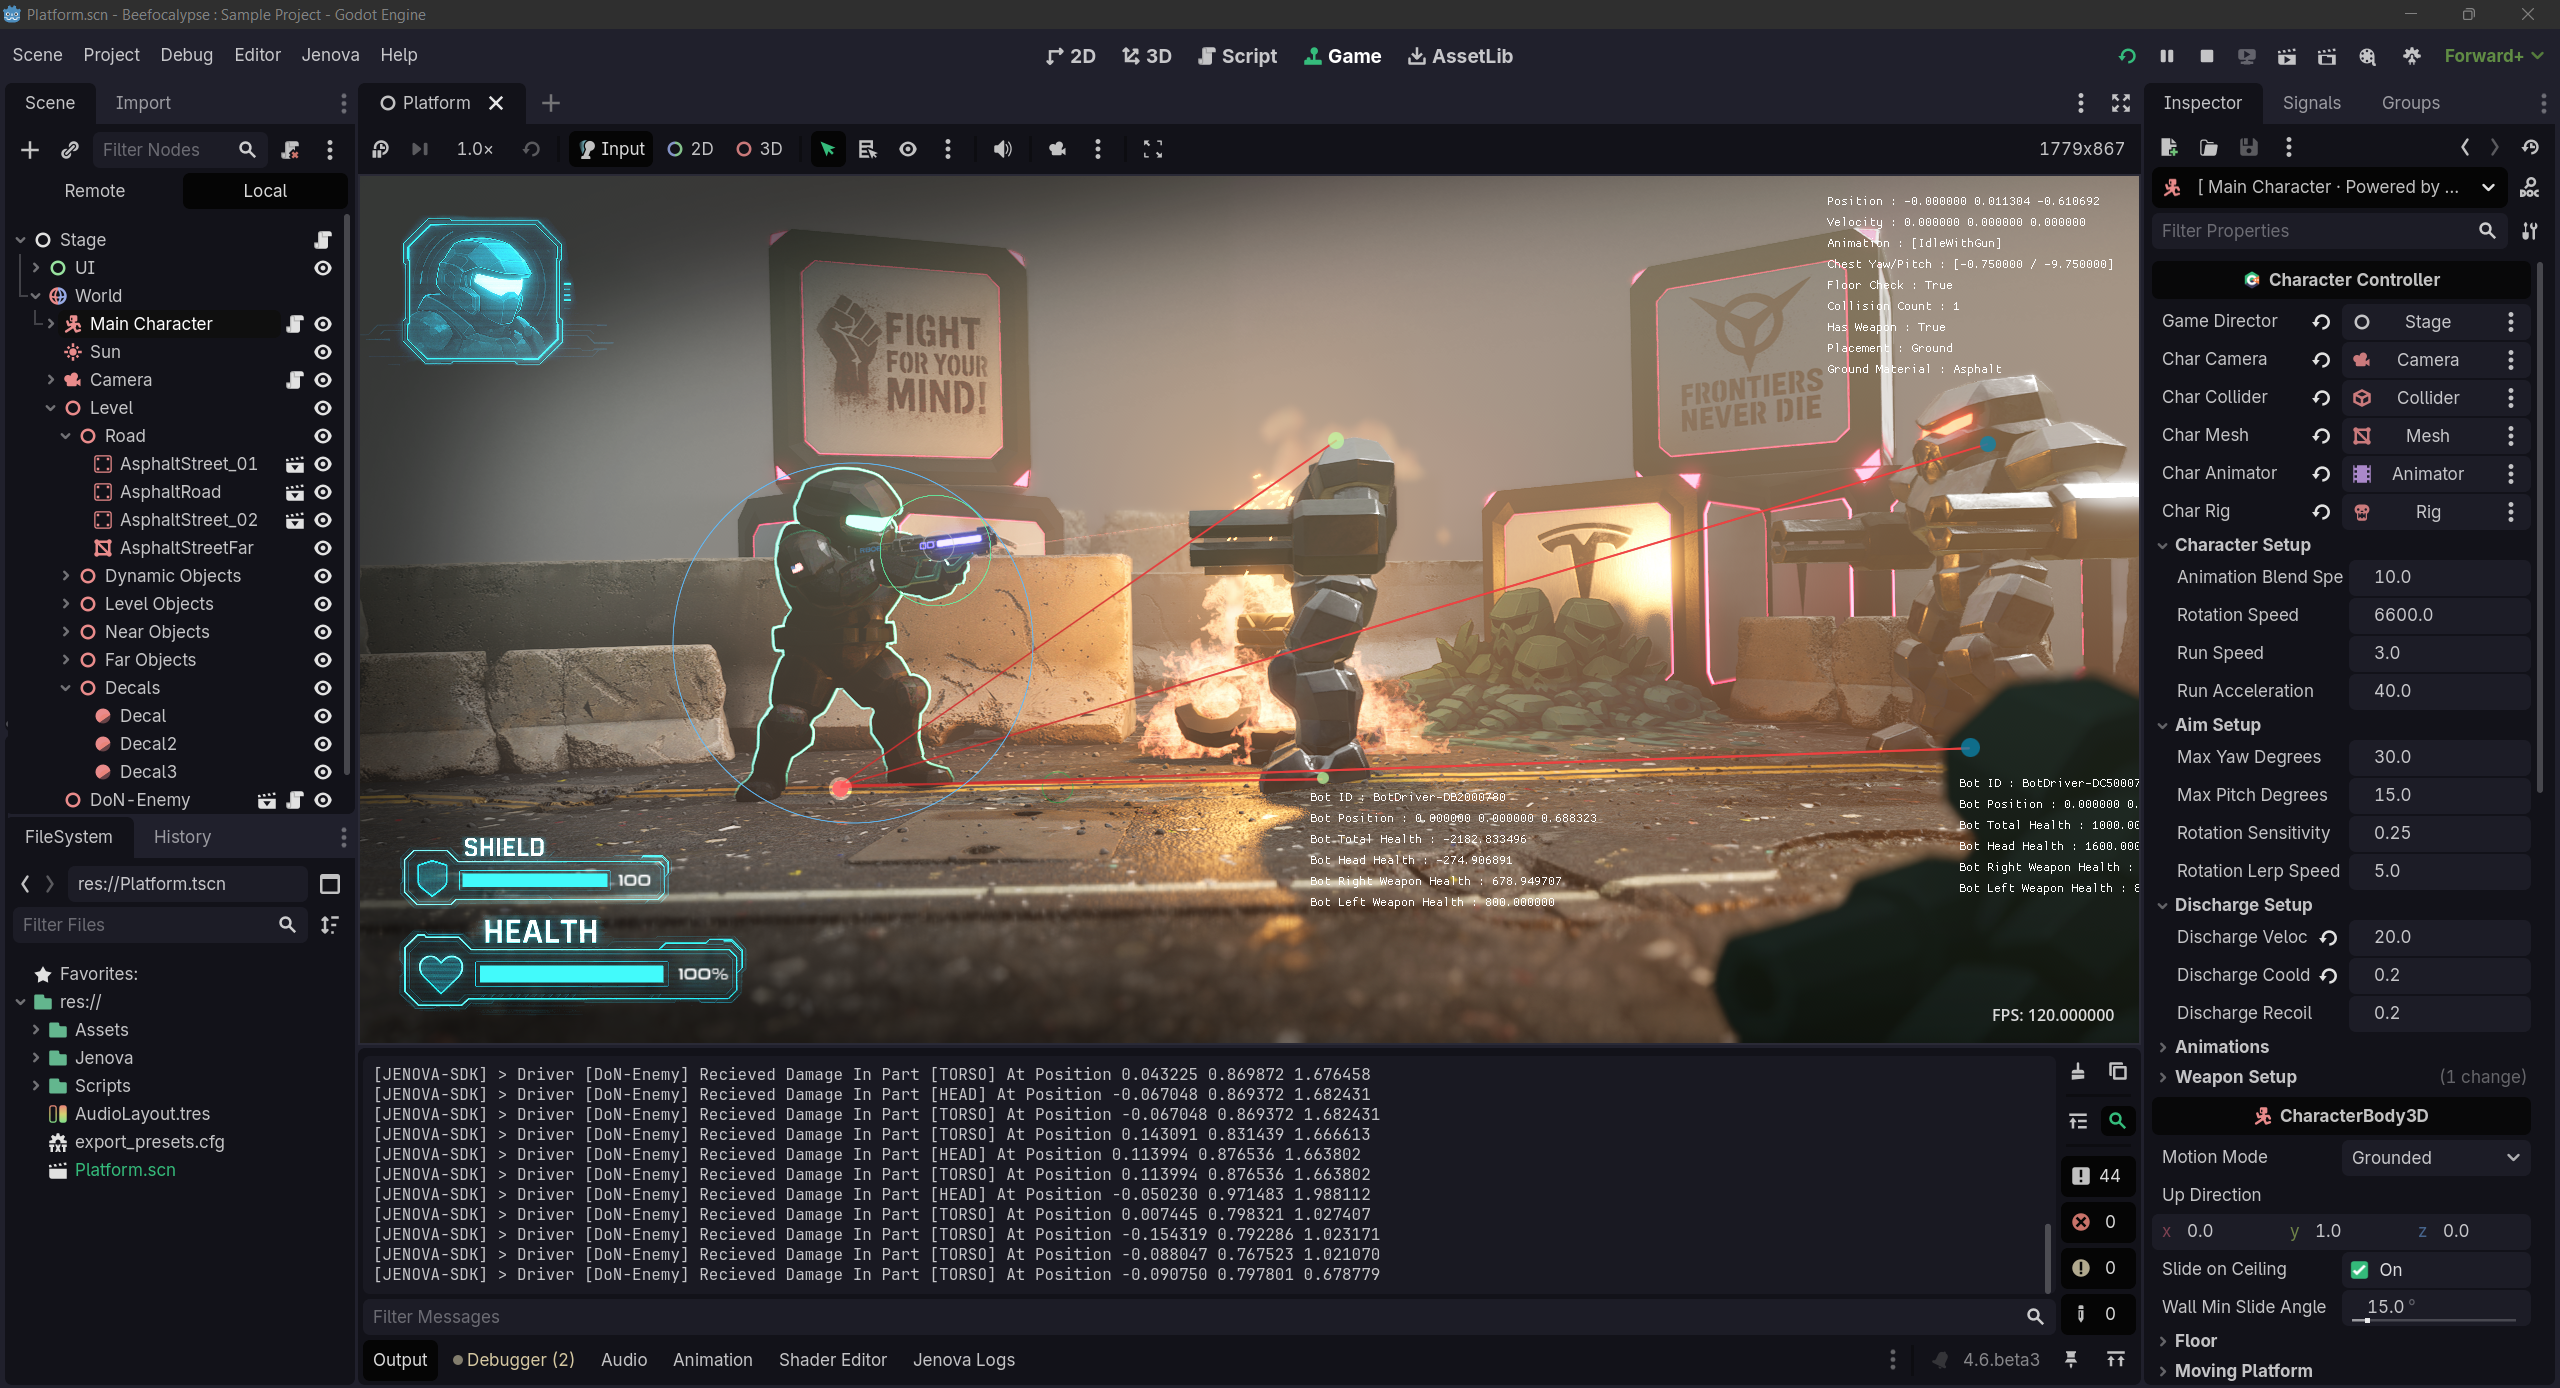
In addition to code debugging, Visual Debugging plays a critical role in game development by providing a more intuitive and interactive way to identify and fix issues, it involves drawing geometrical visuals and text graphically to display values, distances, shapes, paths, collisions etc.
This feature allows developers to visually inspect and understand complex game mechanics, making it easier to identify and fix issues.
Jenova Framework offers an addon for this purpose built on top of the powerful Dear ImGui library.
To use the visual debugging open the Package Manager from the menu Jenova > Tools > ![]() Package Manager
Package Manager
Then, navigate to the Addons tab and install the Immediate Mode Graphical User Interface package from the available list.
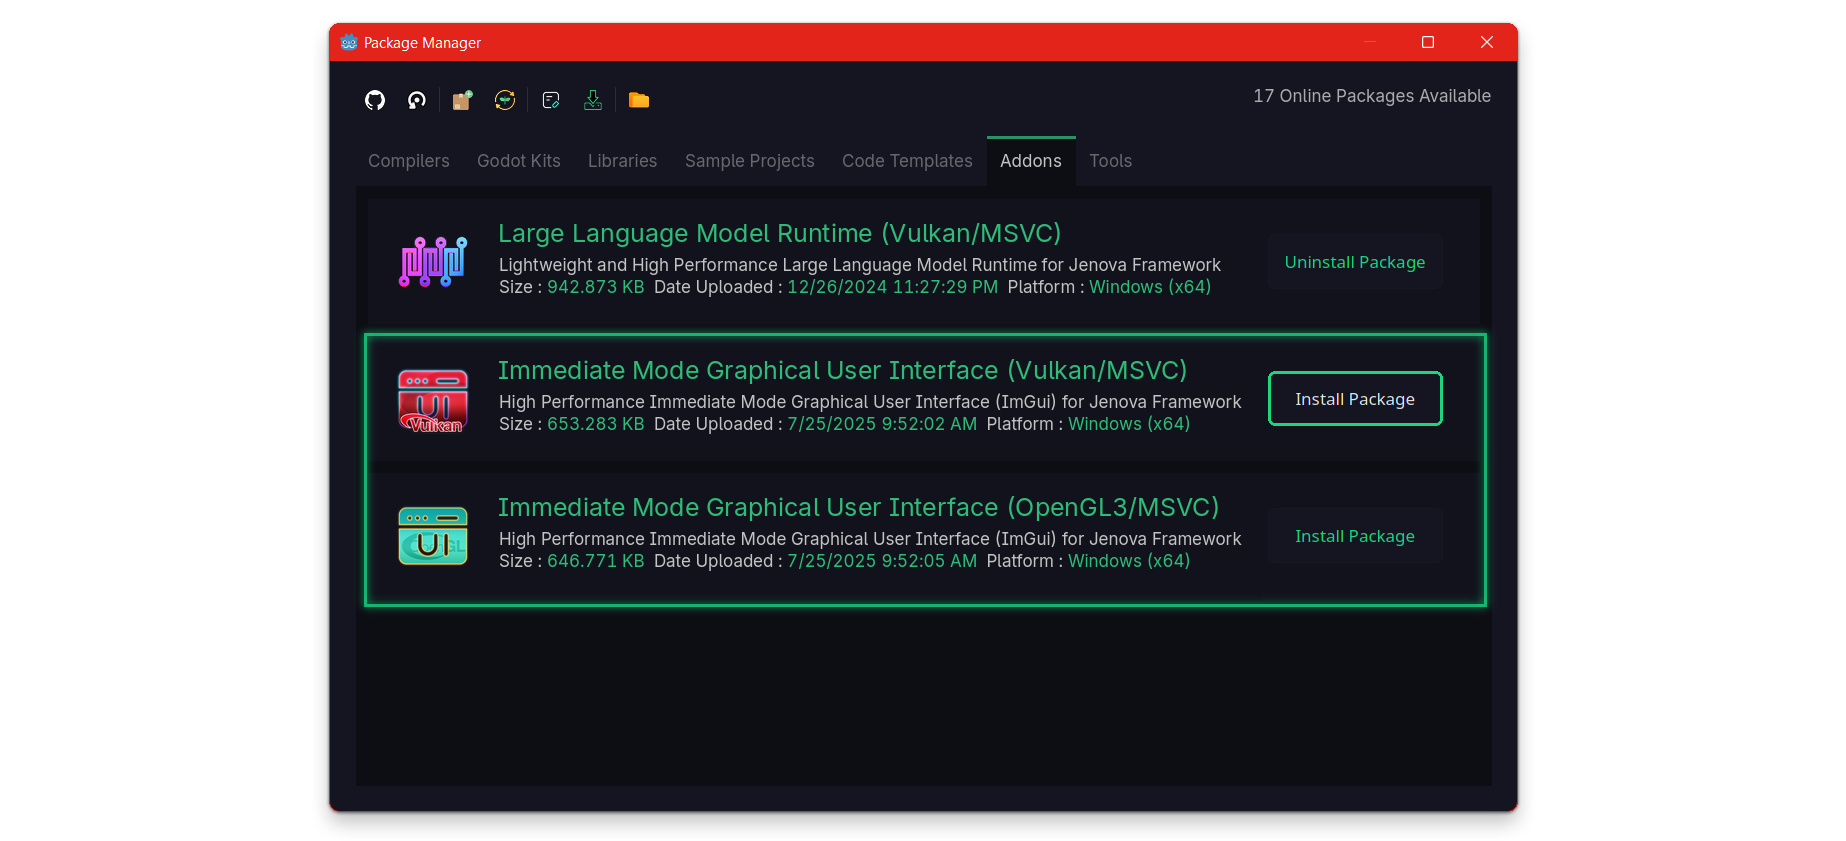
Now you can seamlessly use ImGui in any C++ script within the Jenova Framework.
Profiling C++ Scripts
While C++ scripts can be profiled using standard debuggers, a dedicated and user-friendly profiling tool is also provided for developers.
Jenova Profiler is a dedicated profiler in the ecosystem deeply integrated with the Jenova Interpreter, allowing it to collect execution timing data and generate detailed reports. Additionally, the framework offers a set of functions in JenovaSDK to add stage checkpoints, enabling precise measurement of individual regions of code in each script function.

The framework currently provides three profiling modes: Echo, Sentinel and Monitor. You can configure the profiler from Editor Settings.
-
Echo: When profiling using Echo mode, the profiler broadcasts frame performance over a WebSocket connection.
This method is useful for creating custom performance visualizers. -
Sentinel: When profiling using Sentinel mode, the profiler collects and caches all frame records into a database.
This database is used by the Script Manager to display structured visualizations. -
Monitor: When profiling using Monitor mode, the profiler outputs performance data directly to the engine's native monitors panel.
Using Sentinel Profiler
To start profiling your C++ scripts using Sentinel mode, simply go to the engine's native Profiler tab and begin a capture by hitting Start.
After your capture begins, run the game and then close the game window. Do not use the stop button in RunBar as it terminates the game.
Sentinel requires a graceful termination to write the database. You can use the Jenova Developer Console and input the quit command.
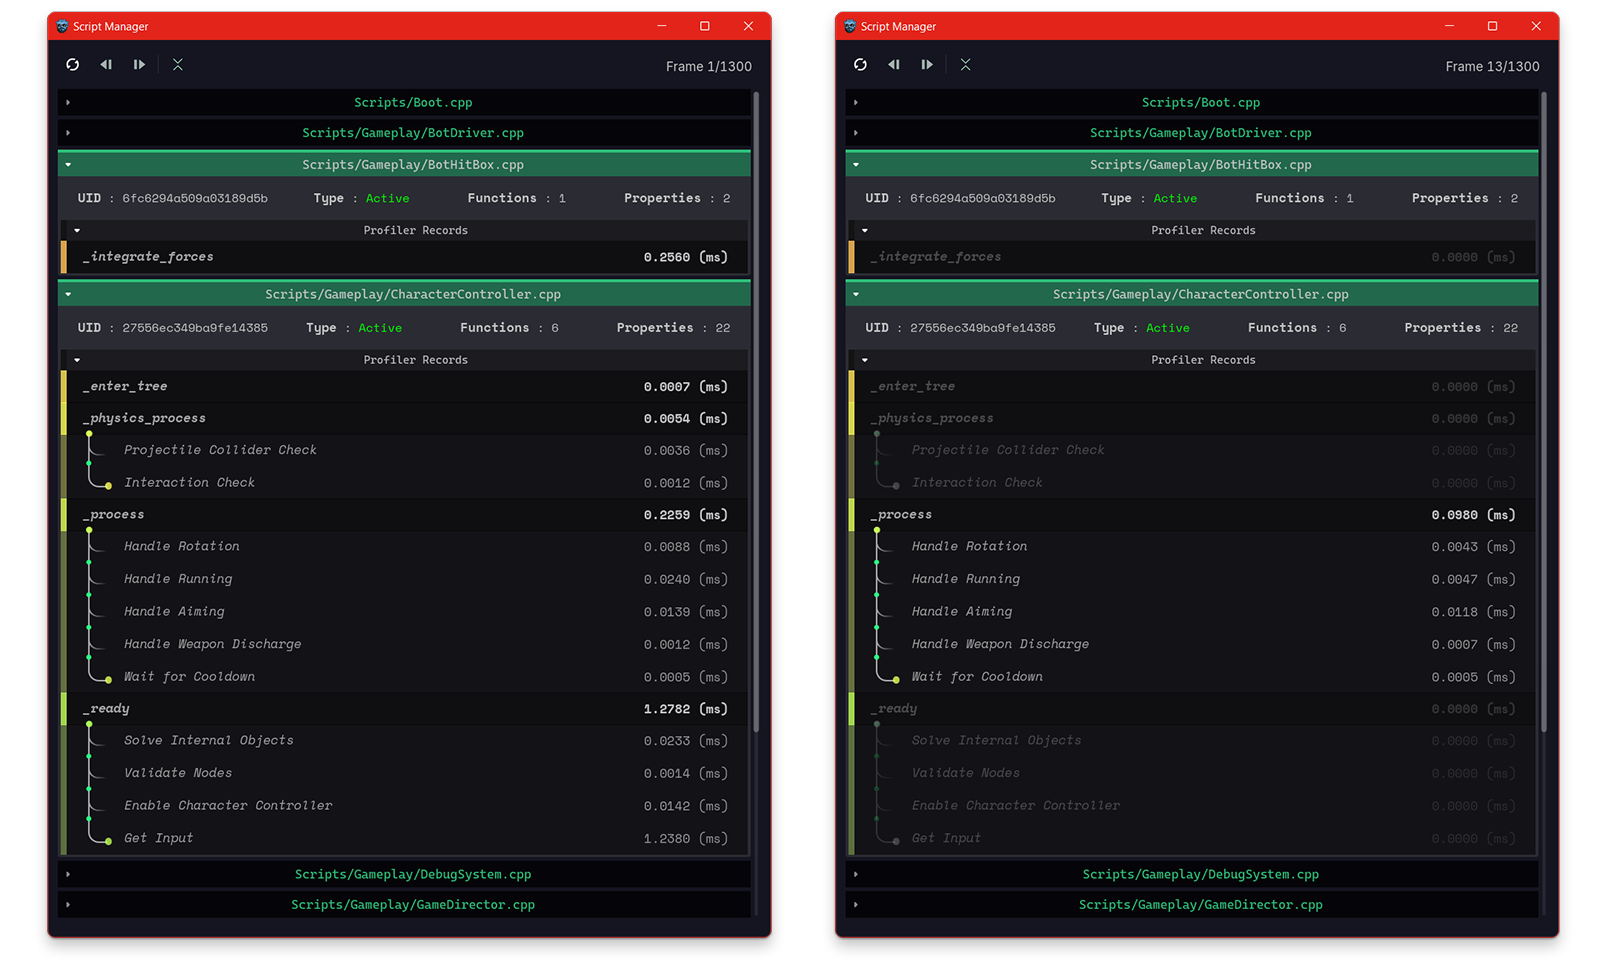
Now that you have the profiler database, simply open Script Manager using the menu Jenova > Tools > ![]() Open Script Manager...
Open Script Manager...
In the Script Manager window, you can change the frame index and see the records for each function and stage.
If a function wasn't executed in the frame, it will be grayed out.
Stage records can be added to profiler by using CommitRecord API from JenovaSDK.
Here's an example :
// Controller Command Events
void PickedWeapon(String weaponName)
{
	Node3D* weaponNode = (Node3D*)CharBody->find_child(weaponName);
	sentinel::CommitRecord("Find Weapon Node");

	ProjectileEmitter = (Node3D*)weaponNode->find_child("Projectile Emitter");
	sentinel::CommitRecord("Find Projectile Emitter");

	MuzzleFlashFX = (Node3D*)weaponNode->find_child("MuzzleFX");
	sentinel::CommitRecord("Find Muzzle VFX");
}
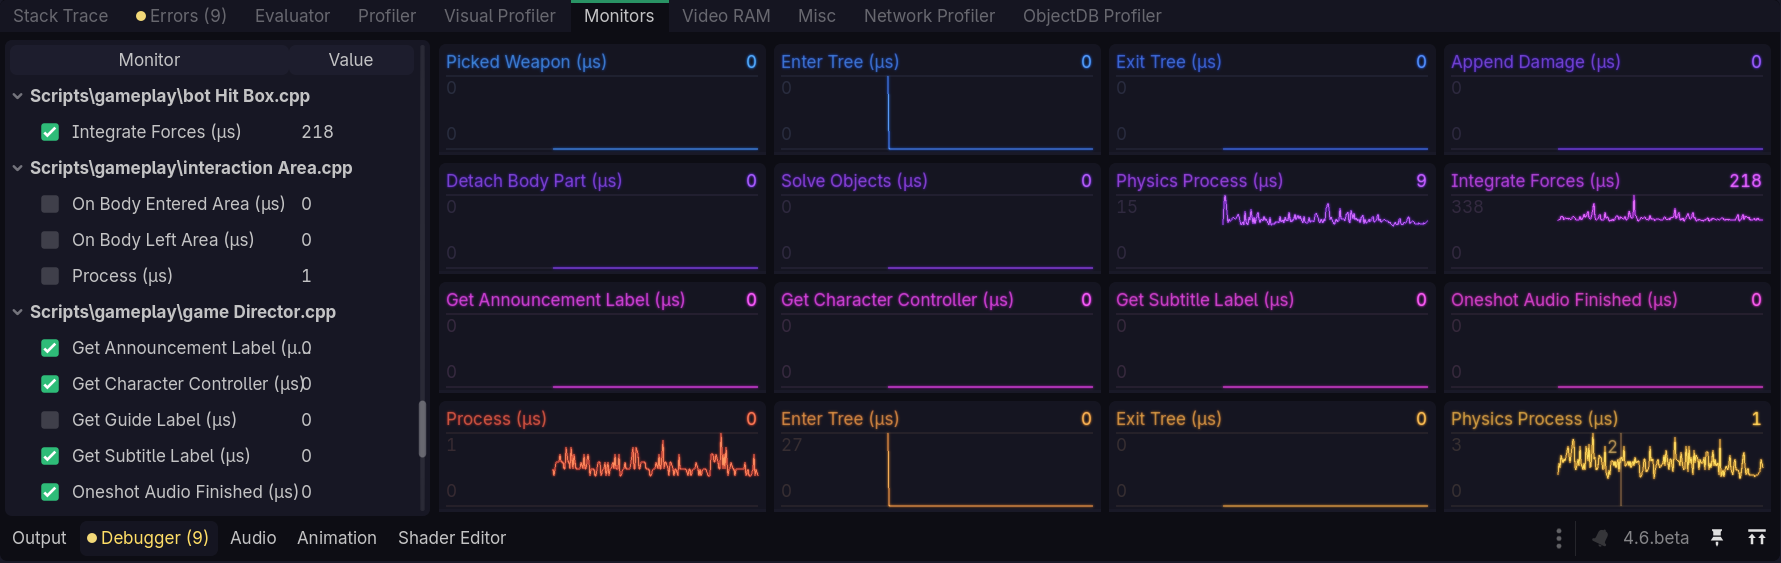
Using Monitor Profiler
Starting profiling using Monitor mode is pretty straightforward. Simply go to the engine's Monitors tab to view the C++ script functions.
- Changing the profiler mode in Editor Settings requires a full project rebuild, even when it is set to Disabled.
- Only Echo and Sentinel modes support Stage Records.